
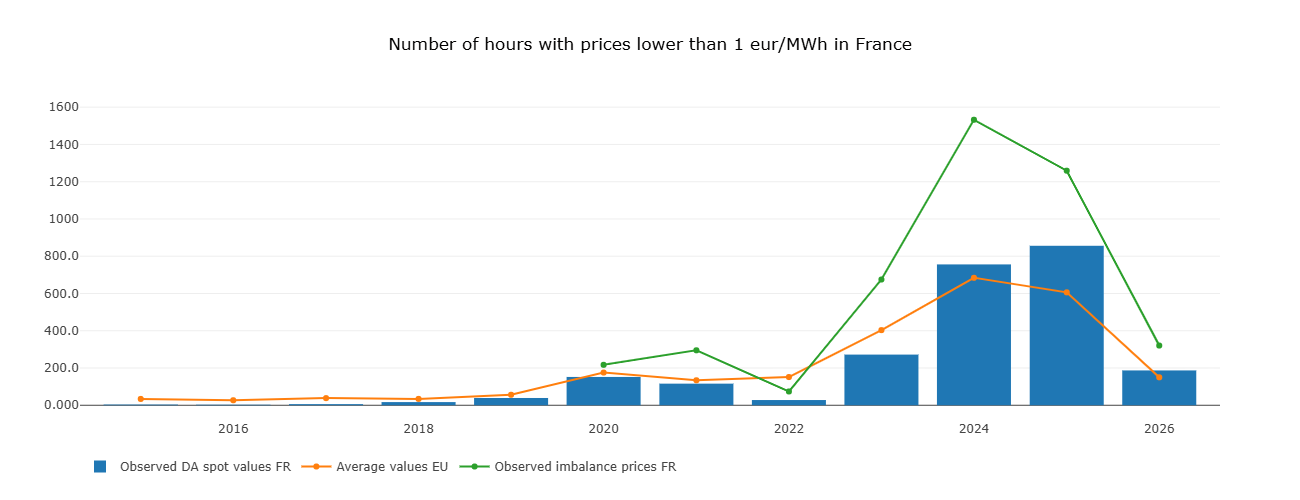
France recorded more hours with prices at or below zero in the first three months of this year than during the entire COVID lockdown year of 2020. Spain logged nearly 350 such hours in the same period — five times more than in Q1 2025. And we are still weeks away from the peak of the solar season.
In this article, we look at what the data actually shows across France, Germany and Spain, using production-weighted metrics and period-aligned comparisons to get past the noise. The picture that emerges is one of structural divergence: three countries experiencing the same renewable build-out, but with radically different outcomes depending on the flexibility of their grids.
Choosing the right metric
The standard measure — "negative price hours" — is becoming a less reliable signal as market regulations increasingly force renewable operators to curtail production at prices at or below zero. When curtailment is mandatory, the count of negative hours is partially suppressed by the regulation itself, not by storage or demand response absorbing the surplus.
We therefore work with a threshold of below 1 €/MWh rather than at or below zero. At this level, storage and flexibility assets can charge at near-zero cost and capture the full spread against peak prices.
143 additional hours of structural surplus — a 30% undercount using the classical metric.
The logic of this threshold is straightforward: a battery charging at 0.5 €/MWh captures essentially the same value as one charging at −5 €/MWh. The economic boundary is not at zero — it is at whatever level makes charging negligible relative to discharge value.
All metrics in this article were computed directly from hourly ENTSOE and RTE time series using the Timeseries Refinery by Pythonian, which allows production-weighted capture rates, curtailment proxies, and period-aligned comparisons to be expressed as reproducible formula queries over live market data — and updated automatically as new data arrives.
Three countries, three stories
Germany: the exception that teaches us something
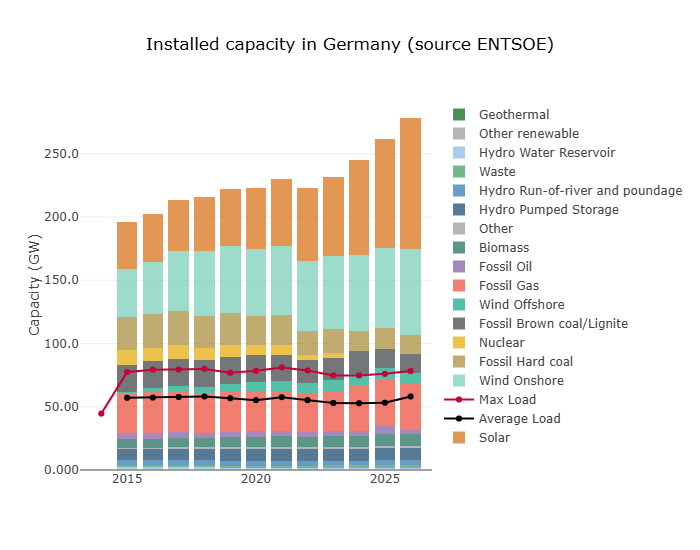
Germany has added more installed capacity than any other European country over the past decade. Total installed capacity has grown from approximately 200 GW in 2015 to nearly 275 GW today — a 37% increase, driven primarily by solar and offshore wind layered on top of an already large onshore wind fleet. Over the same period, average load has remained essentially flat at around 55 GW, and peak demand at around 80 GW. The capacity-to-load ratio now approaches 5×.
Yet in Q1 2026, Germany recorded only 65 hours below 1 €/MWh — virtually unchanged from 67 hours in Q1 2025.
This is the central counterpoint of this article. A country that has absorbed the largest absolute volume of new renewable capacity in Europe is keeping its surplus hours under control. The reasons are visible in the capacity chart: a diversified mix where wind and solar do not systematically coincide, a substantial and flexible gas fleet that can modulate output, meaningful pumped hydro capacity, and strong cross-border interconnections that allow excess to flow outward. Germany is not immune to the structural challenge — full-year 2025 recorded 749 hours below 1 €/MWh, up from 624 in 2024 — but the acceleration is measured, not exponential.
France: the nuclear paradox
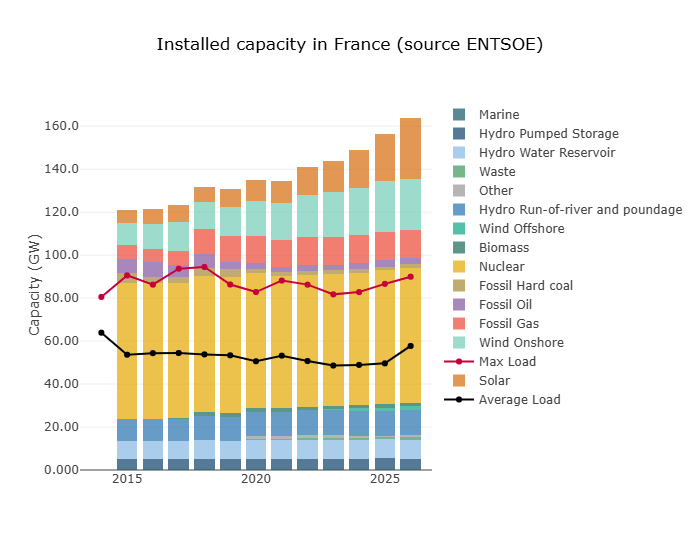
France tells a different story. Total installed capacity has grown from roughly 120 GW in 2015 to 165 GW today, with solar expanding rapidly in recent years. Average load has stayed flat near 52 GW. But the near-zero hour count has exploded: 28 hours in Q1 2025, 140 hours in Q1 2026 — a fivefold increase in a single year.
The structural reason is nuclear. France's 63 GW of nuclear capacity provides a low-carbon, low-marginal-cost baseload that cannot easily be cycled down. When solar production rises, it competes not with expensive gas plants but with nuclear that is already running. There is limited room in the residual load for solar to displace — and nowhere for the surplus to go except into negative prices.
The first nine days of April alone already recorded 45 additional hours below 1 €/MWh in France. The solar season is just beginning.
Spain: a market in structural break
Spain is the most extreme case. Total installed capacity has grown from roughly 105 GW in 2015 to 137 GW today. But Spanish average demand is only around 28 GW — giving a capacity-to-load ratio of nearly 5× on a much smaller demand base than Germany. The solar surge is piling onto an already saturated system.
In Q1 2026, Spain recorded 490 hours below 1 €/MWh — up from 129 in Q1 2025. Combined with the first nine days of April, the country is already well past its full-year 2024 total of 1,064 hours, and is on pace to far exceed the 2025 full-year figure of 1,049 hours before the end of June.
The most striking single data point: in March 2026, the Spanish average spot price was 16.5 €/MWh — despite gas prices at 53 €/MWh. The renewable volume is now so dominant in the Spanish merit order that the gas price signal barely transmits into power prices at all.

The collapse of solar capture rates
One of the most direct measures of renewable market saturation is the production-weighted capture rate: the price that a renewable generator actually captures, expressed as a percentage of the average market price over the same period. A rate below 100% means the technology is producing systematically in hours when prices are below average — the so-called cannibalization effect.
| Q1 Year | France | Germany | Spain |
|---|---|---|---|
| 2019 | 93.5% | 94.1% | 99.1% |
| 2021 | 95.1% | 87.8% | 94.2% |
| 2022 * | 100.8% | 98.3% | 94.7% |
| 2023 | 95.5% | 92.4% | 87.0% |
| 2024 | 86.2% | 83.8% | 69.4% |
| 2025 | 80.4% | 67.1% | 71.8% |
| 2026 | 63.1% | 68.2% | 53.6% |
* In Q1 2022, French solar captured a premium due to the simultaneous gas crisis and low nuclear availability — both conditions have since reversed.
The 2022 figures stand out. In Q1 2022, French solar captured a premium above the market average (100.8%). This was not a sign of market health. It was the combined effect of two simultaneous crises: gas prices at 82–126 €/MWh kept expensive gas plants on the margin even during peak solar hours, and French nuclear availability was declining towards its historic trough. Both conditions have since reversed.
Today, Spanish solar captures less than 54% of average market price — in a quarter that is still winter. Wind tells a different story.
| Q1 Year | France | Germany | Spain |
|---|---|---|---|
| 2019 | 89.7% | 81.5% | 97.4% |
| 2022 | 90.2% | 73.4% | 97.6% |
| 2024 | 90.9% | 87.2% | 80.0% |
| 2025 | 82.8% | 82.8% | 89.5% |
| 2026 | 88.0% | 87.2% | 88.9% |
Wind capture rates are stable to slightly improving across all three countries in Q1 2026. Wind cannibalization is predominantly a summer and high-production phenomenon. In winter, wind production is spread across more hours and correlates less tightly with itself. The divergence between solar and wind capture rates is the central structural story: same market, same regulatory environment, completely different trajectories.
The 2026 gas "crisis" is not 2022
A gas price increase in March 2026 — from approximately 35 €/MWh in January to 53 €/MWh in March on the THE hub — has prompted some commentary about a new energy crisis. The comparison with 2022 does not hold.
In March 2022, THE gas reached 126 €/MWh. By August 2022, it peaked at 236 €/MWh — nearly 4.5 times the current level. French spot prices hit 295 €/MWh in March 2022 and 493 €/MWh by August. The 2022 crisis was a genuine supply shock that propagated through the entire merit order.
The March 2026 level is more comparable to autumn 2021 — elevated but manageable. More importantly, the market response is now completely different. In Spain, March 2026 saw average spot prices of just 16.5 €/MWh — in the same month that gas traded at 53 €/MWh. The gas-to-power price transmission mechanism has effectively broken down in the Spanish market.
For solar and wind investors, the implication is significant. In 2022, the gas crisis temporarily boosted renewable capture rates — solar in France briefly captured above-market prices. That buffer no longer exists in the same way. Even a substantial gas price move barely registers in capture rates when renewable volume is the dominant factor in the merit order.
Curtailment: the confirming signal
A third angle confirms the picture. We compute a curtailment proxy by comparing ENTSOE day-ahead generation forecasts with actual observed production, filtering only to hours when spot prices were below 1 €/MWh, and retaining only the positive delta (forecast exceeded actual — the curtailment direction). This is not a precise curtailment measurement — forecast errors also contribute — but as a trend indicator it is consistent and directionally reliable.
The results for Spain are striking. Combined wind and solar curtailment proxy in Q1 2026 alone reached approximately 3,800 GWh — already exceeding the full-year 2025 total of approximately 3,100 GWh, with nine months of the year still to run. The solar season has not yet begun in earnest.
Germany, by contrast, shows wind curtailment growing from 133 GWh in 2022 to around 1,100 GWh in 2025, but without the explosive acceleration seen in Spain. France shows a consistent upward trend in wind curtailment (32 GWh in 2022 to nearly 1,000 GWh in 2025), consistent with the near-zero hour count trajectory.
The curtailment proxy and the near-zero hour count together provide a coherent and mutually reinforcing signal: renewable generation is growing faster than the market's capacity to absorb it through storage, demand response or exports.
What Germany tells us about solutions
Germany's relative resilience is not accidental, and it matters for the policy conversation. The country has added more renewable capacity than France or Spain in absolute terms while keeping surplus hours comparatively stable. The key variables appear to be grid architecture — diversified technology mix, strong interconnections, flexible gas — rather than any single policy lever.
Spain's situation is structurally harder: a small demand base, a grid at the end of the European interconnection chain, and a solar build-out that has outpaced the development of storage and demand flexibility. The 2024 and 2025 Iberian solar record negative price counts are not anomalies — they are the new baseline, and 2026 is already running well above them.
France sits between the two: nuclear provides stability but also rigidity. As solar capacity grows, the hours of surplus will increasingly coincide with the hours when nuclear is producing at full output and cannot reduce. The structural solution — more storage, more flexible demand, more interconnection — is identical across all three markets.
Conclusion
The first quarter of 2026 has provided a clear signal: the renewable surplus in European power markets is not cyclical — it is structural, and it is accelerating. Germany shows that the trajectory is not inevitable — flexibility and diversification can absorb significant capacity additions without proportionate price distortion. Spain and France, each for different structural reasons, show what happens when that flexibility is insufficient.
As the solar season opens in April and May, we expect the metrics to deteriorate sharply in France and Spain before any reversal. Storage deployment will need to accelerate significantly — not just in volume, but specifically in markets where the surplus is most acute — to begin bending these curves.
We will update this analysis as the season progresses.
About this analysis
The metrics in this article — near-zero price hour counts, production-weighted capture rates, and the ENTSOE curtailment proxy — were built and computed using the Timeseries Refinery by Pythonian, a time series data management and analytics platform designed for energy market analysts.
The platform allows analysts to combine heterogeneous data sources (ENTSOE, RTE, EEX, ECMWF and others) in a single environment, express complex metrics as simple versioned formula queries, and update results automatically as live market data arrives — without rebuilding pipelines.
This article was produced with the assistance of an AI agent connected directly to the Refinery via its MCP interface — querying live time series, computing metrics and cross-checking results in a single conversation. The analysis that would typically take days of data engineering was completed in hours.
Data sources: ENTSOE, RTE, EEX.
Request a demo