
Four years ago, Germany was the cheaper of the two. In 2022, French wholesale power traded 40 €/MWh above Germany. Today France sits 38 €/MWh below it — a 78 €/MWh swing on a single spread in four years.
I have been tracking European day-ahead spot prices across the continent, and the notable development this spring is not any single country's level. It is that the prices have stopped moving together. Europe used to behave largely as one power market with local variation; it now resembles two distinct price regimes.
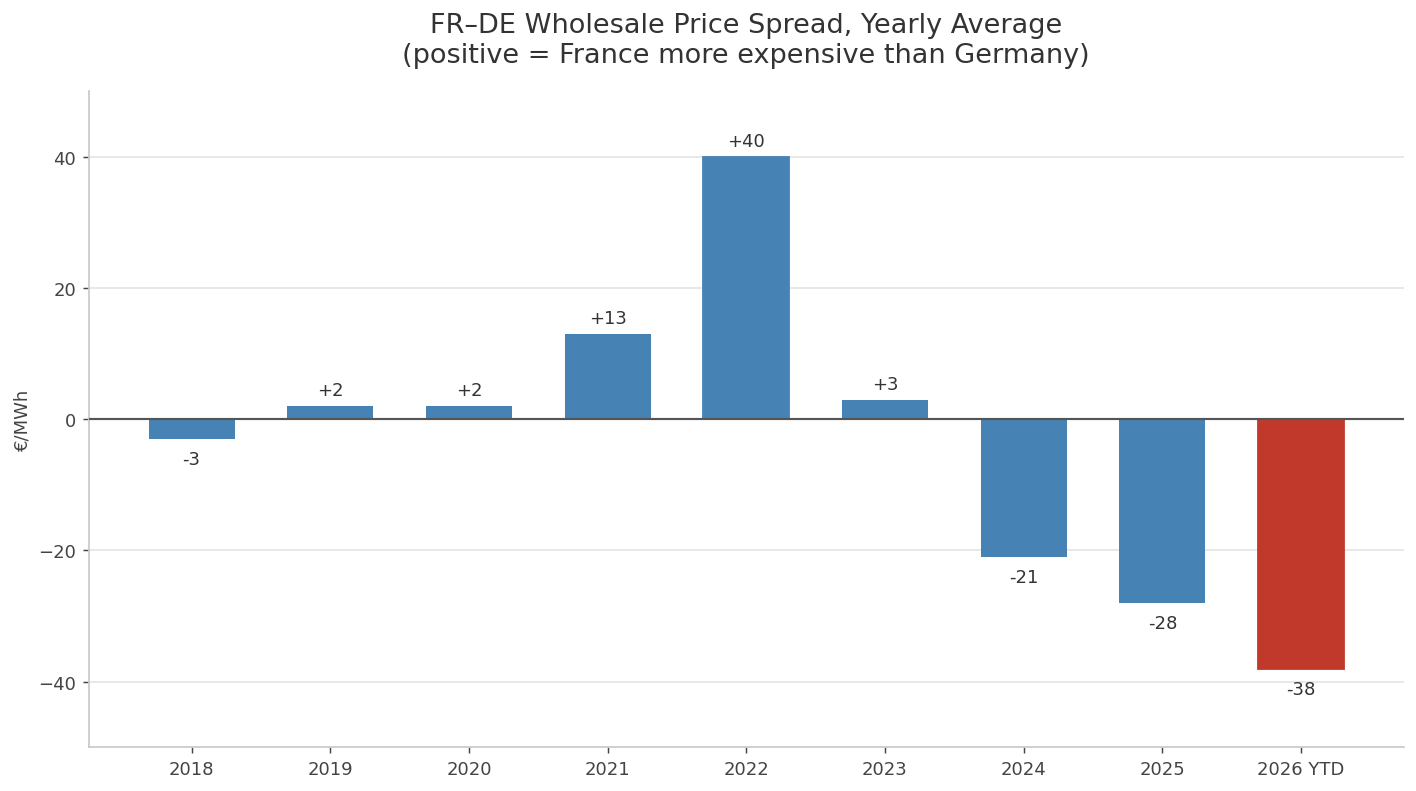
The chart above shows the FR–DE spread year by year, on a consistent convention: positive means France is the more expensive of the two. The move from +40 €/MWh in 2022 to −38 €/MWh today is substantial. Germany has climbed for three straight years while France has held flat. Both countries pay the same gas price and sit under the same carbon market, so the gap is not driven by fuel — it is structural.
Two Europes
Beyond the FR–DE pair, the same pattern repeats across the continent. The post-crisis years have sorted Europe's large markets into two clusters.
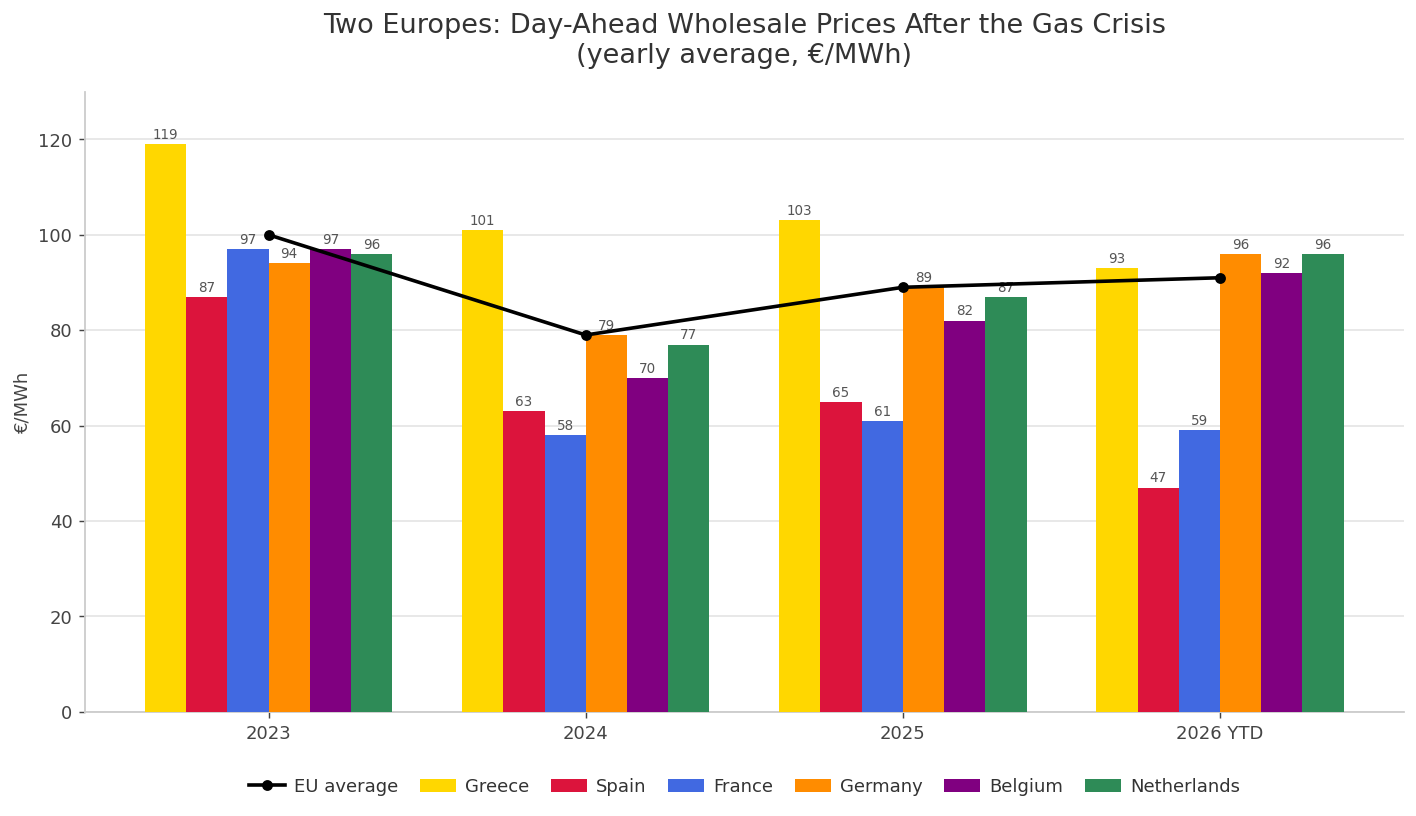
On one side, a low-price Iberian–French group: Spain at 47 €/MWh year-to-date, France at 59 €/MWh. On the other, a high-price DACH–Benelux cluster, with Germany, Belgium and the Netherlands between 92 and 96 €/MWh. At the extremes, the high-price cluster is roughly double the low one — Spain at 47 against Germany at 96.
Greece is a third case. Historically it sat above the European average every year. In 2026 it has converged into the pack, at 93 €/MWh against an EU mean of 91 — effectively level with the continent for the first time in the series. Greece is following, from above, the trajectory Iberia took about two years earlier.
| Year | Greece | Spain | France | Germany | Belgium | Netherlands | EU |
|---|---|---|---|---|---|---|---|
| 2018 | 60 | 57 | 50 | 53 | 55 | 53 | 53 |
| 2019 | 64 | 48 | 39 | 38 | 39 | 41 | 45 |
| 2020 | 45 | 34 | 32 | 30 | 32 | 32 | 34 |
| 2021 | 116 | 112 | 109 | 97 | 104 | 103 | 108 |
| 2022 | 280 | 168 | 276 | 236 | 245 | 242 | 245 |
| 2023 | 119 | 87 | 97 | 94 | 97 | 96 | 100 |
| 2024 | 101 | 63 | 58 | 79 | 70 | 77 | 79 |
| 2025 | 103 | 65 | 61 | 89 | 82 | 87 | 89 |
| 2026 YTD | 93 | 47 | 59 | 96 | 92 | 96 | 91 |
ENTSO-E day-ahead spot, year-to-date as of 18 June 2026.
Four countries, four trajectories
Spain — the clearest case
Spain is where the bifurcation is most visible. At 47 €/MWh year-to-date, down from 65 last year, it is the cheapest large market in Europe by a wide margin. Behind that number is a large solar build-out that has crossed a threshold: renewables now set the price for a majority of hours, and the gas signal transmits much less than it used to. An electro-intensive plant choosing a site today would see Spain at less than half of Germany's wholesale cost.
Greece — convergence from above
Greece spent a decade as one of the more expensive markets on the continent, structurally above the EU average. The 2023–2025 solar wave has pulled it into the pack. It is worth watching because it is following the Iberian path with a roughly two-year lag — the same driver, the same direction, earlier in the curve.
France — the steady reference
France is the stable reference point. At 59 €/MWh it is in line with 2024 and 2025, remaining one of the cheapest large markets in Europe year after year, without a spike or a sustained climb.
Germany — the outlier
Germany is the one that stands out. It has climbed three years running — 79, then 89, now 96 €/MWh — and for the first time in the series it sits above the EU average. This is the highest German average since the gas-crisis peak of 2022, and the gap to France is still widening.
A common expectation is that more renewables will bring this down. The data does not yet support that. Despite continued solar additions, Germany's share of hours below 1 €/MWh is flat to slightly lower in 2026 — not the increase a growing build-out would imply. The renewable-surplus effect associated with the energy transition is appearing in Spain and France rather than in Germany, where gas plus carbon still sets the marginal price often enough to keep the average up. Belgium and the Netherlands sit in the same regime, shaped by the same market coupling and the same gas-set margin.
Where the surplus is forming
Another way to see the divergence is to count the hours when power is effectively free — below 1 €/MWh, the level at which storage can charge at negligible cost. (I use below 1 €/MWh rather than below zero because mandatory curtailment increasingly suppresses the strictly-negative count, understating the true surplus.) Projecting the current year-to-date pace forward, the split is clear:
| Country | 2025 | 2026 (projected) |
|---|---|---|
| Spain | 12% | ~20% — roughly one hour in five |
| Greece | 5.6% | ~14% |
| France | 10% | ~14% |
| Germany | 8.6% | ~8% (flat) |
| Belgium | 7.6% | ~7% |
| Netherlands | 8.4% | ~7% |
Linear projection from year-to-date pace. Greece has already passed its full-year 2025 count of sub-1 €/MWh hours with more than half of 2026 still ahead.
The low-price cluster is accumulating free hours; the high-price cluster is flat to declining. Spain is on track for roughly one hour in five below 1 €/MWh this year, while Germany, despite adding capacity, holds flat. Whatever is compressing prices in Iberia is not reaching the DACH region.
The policy gap
This is where the divergence shifts from a market observation to an industrial one. Consider a decision to build an electric-arc steel mill, an aluminium smelter, a chlor-alkali plant or a hyperscale data centre. That decision commits capital for ten to twenty years, and the relevant figure is the expected weighted-average wholesale electricity cost over that horizon — not installed capacity in gigawatts, nor renewable share in percent, but a price.
Here the national frameworks have diverged. Spain pairs its solar build-out with contract-for-difference auctions that publish explicit strike prices. France anchors its historic fleet around an explicit price target. Several countries are embedding long-term industrial contracts at a known €/MWh. In each case, an industrialist can read a number off the policy and plan against it.
Germany's framework is built almost entirely around installed-capacity targets — gigawatts of solar, wind, batteries, electrolysers — and renewable-share percentages. There is no published "delivered wholesale €/MWh" objective for industry. The levy reform moved the cost question into the federal budget, and with it the conversation moved further from any explicit price commitment. A fifteen-year capex decision cannot be made against a renewable-share target; it requires a price target. Iberia provides one; Germany does not.
Several objections are worth addressing directly.
"Germany's high price is just gas and carbon pass-through — it's cyclical." Partly true on the absolute level. But the FR–DE spread cannot be explained that way: the two countries pay the same gas and sit under the same carbon market. The 38 €/MWh gap reflects how much renewable penetration has decoupled the average from the gas-set margin. Iberia has crossed that threshold; Germany has not.
"Germany has invested massively in renewables — this can't be a policy failure." Two points qualify that. Its share of sub-1 €/MWh hours is flat to slightly lower in 2026, which is not what continued solar additions would produce if the build-out were structurally working. And onshore wind — the technology that matters for the non-midday hours — has been roughly stagnant for four years.
"More flexibility — batteries, demand response — will normalise German prices." This one is more subtle, and the causality may run the other way. Battery business cases need a wide spread between peak and trough to amortise. Germany's distribution is narrow: anchored at the top by gas, rarely going deeply negative at the bottom. A compressed spread reduces the returns available to new flexibility. The narrow distribution is less a problem that flexibility will solve than a condition that discourages flexibility from being built.
The nuclear factor
I kept nuclear out of the framing above to isolate the policy question, but a complete account of this divergence has to include it. France's structural cheapness rests substantially on its nuclear fleet — low-carbon, low-marginal-cost baseload that holds the average down independently of the renewable build-out.
That leads to a useful comparison. Spain reaches a low wholesale price through a renewable-dominated model; France reaches a comparable level through a nuclear-dominated one. Two different routes converging on a competitive industrial power cost. Germany follows neither, and currently records the highest large-market price of the three. Whether the route matters less than the outcome — a predictable, low delivered cost — is, in effect, the same question the policy gap raises.
What it may signal
German industry has been a central part of Europe's economy for decades. None of this is fixed — capacity can be built, frameworks can be revised, the spread can close. But the direction has been consistent for three years, it appears simultaneously in the spread, the country averages and the free-hour counts, and it tracks a real difference in how countries set energy policy.
The question, then, is not whether German power is expensive this year, but whether this divergence is an early indicator of a longer-term shift in German industry — and whether the policy gap that helped open it is what keeps it open.
About this analysis
The metrics in this article — yearly average wholesale prices, the FR–DE spread, and the sub-1 €/MWh hour counts and projections — were built and computed using the Timeseries Refinery by Pythonian, a time series data management and analytics platform designed for energy market analysts.
The platform lets analysts combine heterogeneous data sources in a single environment, express complex metrics as versioned formula queries, and update results automatically as live market data arrives — without rebuilding pipelines. The charts above were produced from these series, which are tracked in the Refinery and refresh as new ENTSO-E data lands.
This analysis was produced with the assistance of an AI agent connected directly to the Refinery via its MCP interface — querying live time series, computing metrics and cross-checking results in a single conversation.
Data sources: ENTSO-E day-ahead spot. Year-to-date cutoff: 18 June 2026.
Request a demo